Exploring Indicator Visualizations
Validating your investment logic is important, especially when real capital is involved. QuantMage’s indicator visualization feature helps you inspect the data behind your spell so you can confirm that it behaves as expected.
Most incantations work with indicators: Weighted, Filtered, and If/Else are good examples. Weighted uses the Volatility indicator for inverse-volatility weighting. Filtered uses an indicator for ranking, and each If/Else condition can use one or two indicators. Any of these indicator sets can be visualized, but only one set can be shown at a time.
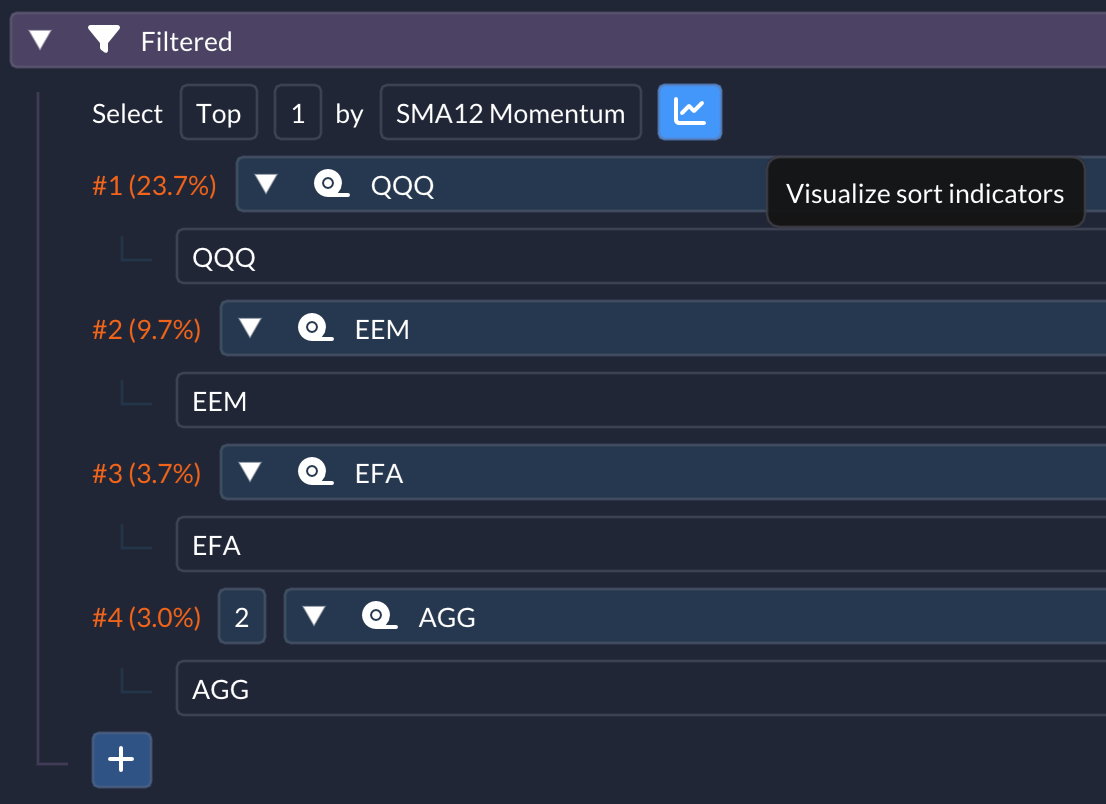
Viewing Filtered’s Sort Indicator
Section titled “Viewing Filtered’s Sort Indicator”To visualize the sort indicator, use the button on the right:
 Once activated, the sort indicator for each involved ticker or subspell is plotted on the main backtest chart:
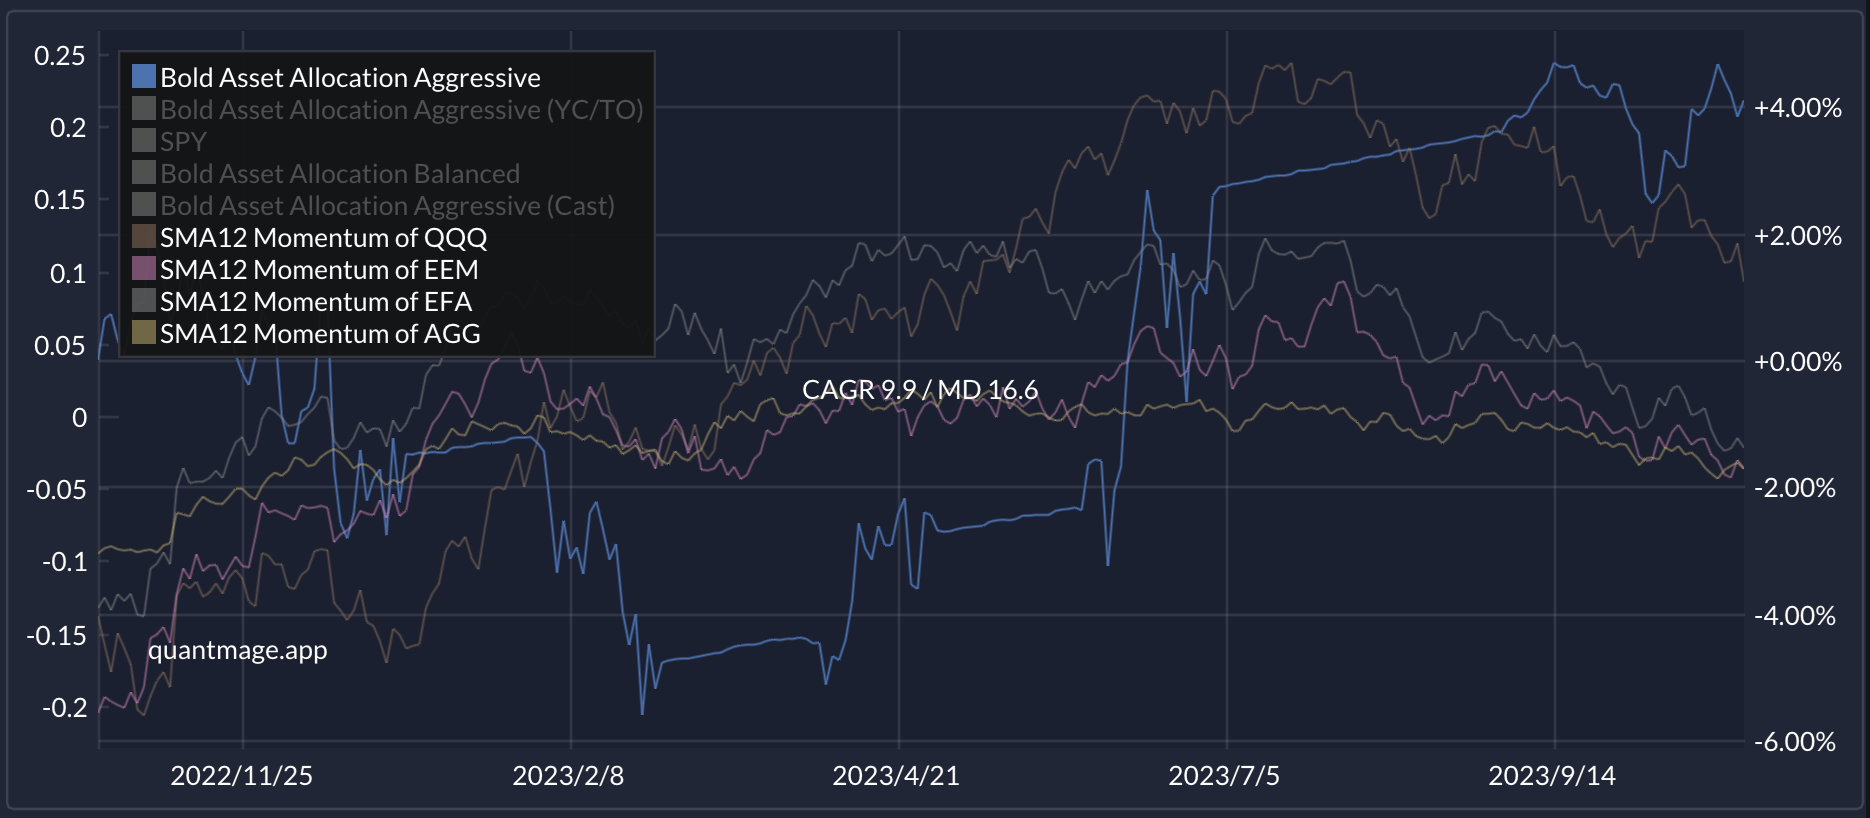 The left side of the chart now shows Y-axis labels for the indicator values.
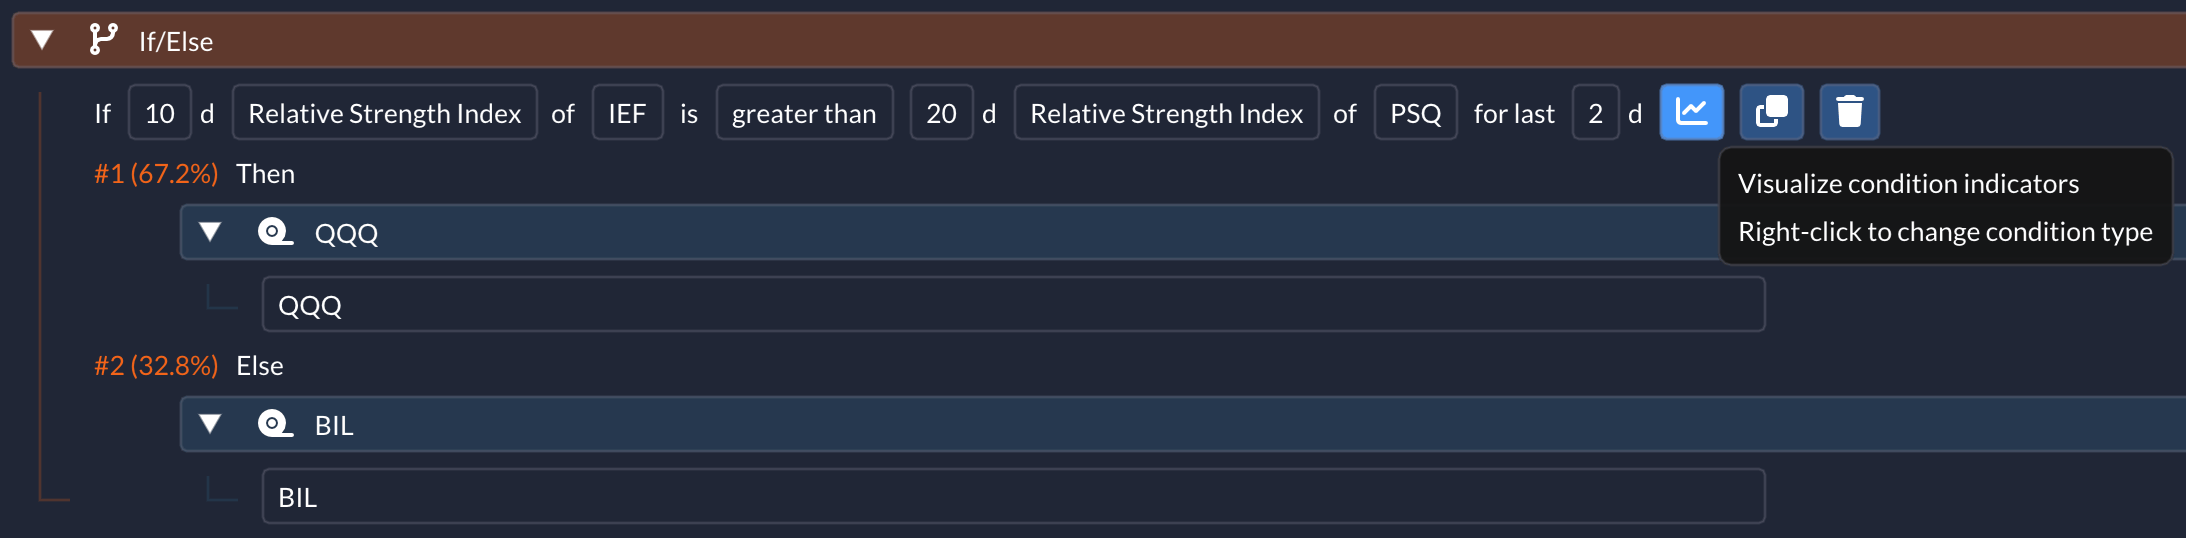
Deciphering If/Else Condition Indicators
Section titled “Deciphering If/Else Condition Indicators”Hover over a condition and use the button on the right to visualize its indicators:
 After activation, the indicators will appear on the chart:
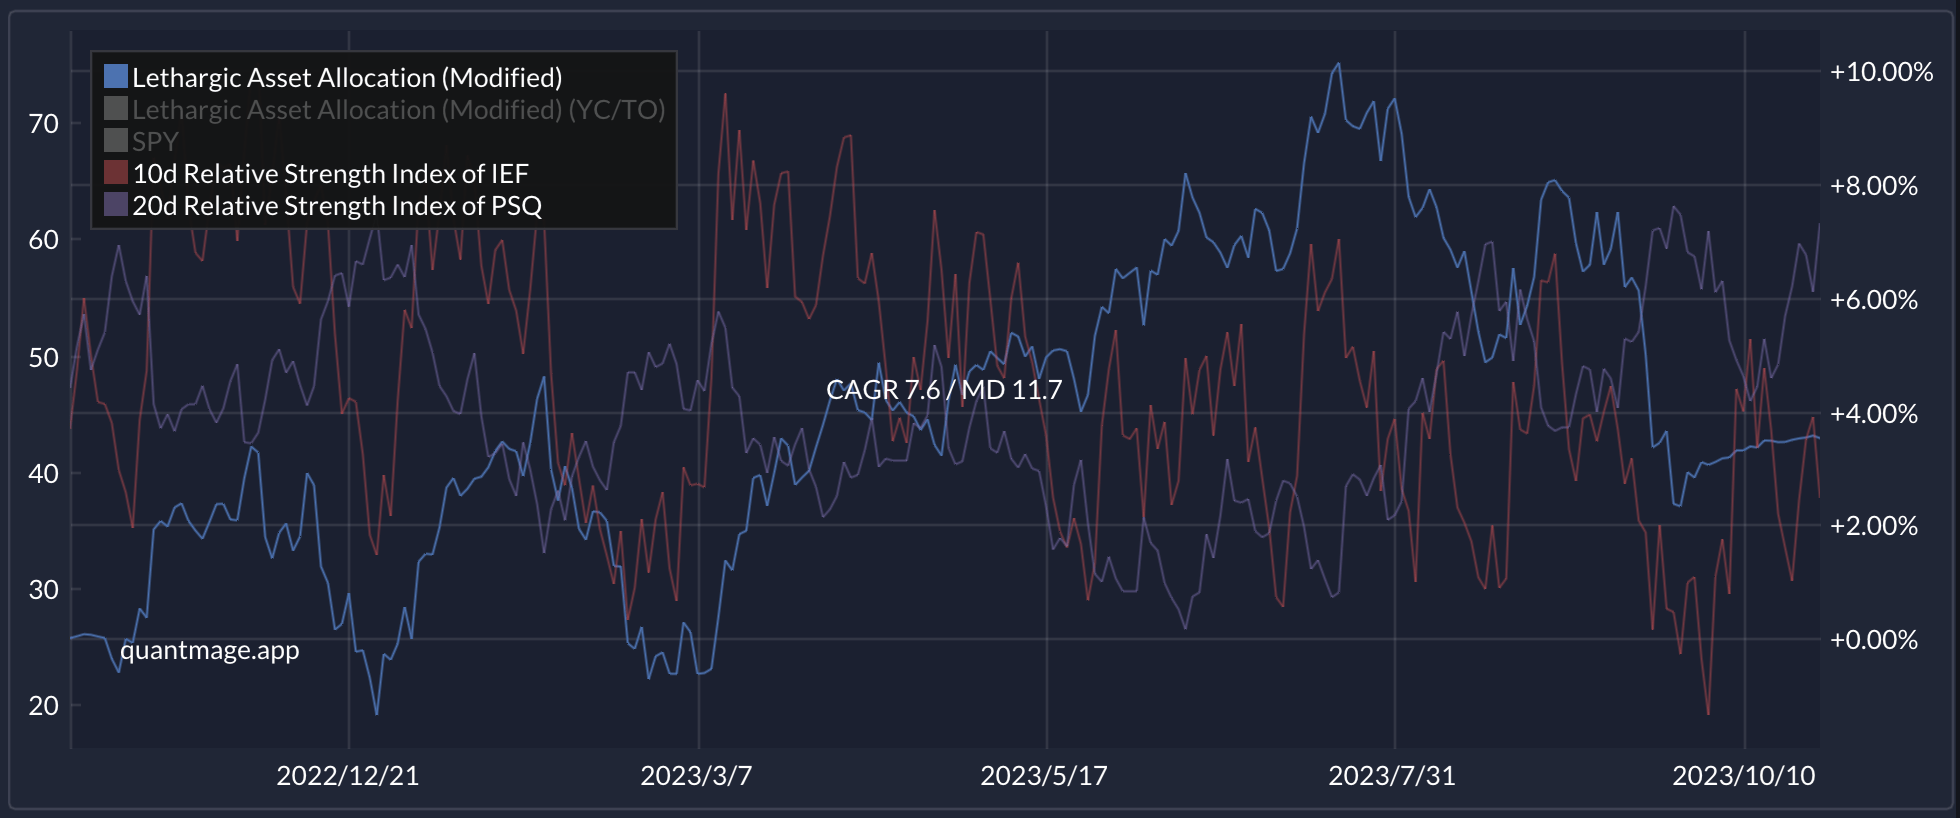
This feature makes it easier to inspect your logic and verify that the underlying signals match your expectations.