Ranking Indicator Percentile/Stochastic
Why you’ll love it
Section titled “Why you’ll love it”Ever wish you could glance at today’s RSI, moving average, or any other indicator metric and know whether it’s screaming “all‑time high” or “dirt‑cheap low” relative to its recent past?
That’s exactly what Indicator Percentile/Stochastic does. A percentile just tells you what share of past data a value beats over your chosen window, while the stochastic oscillator is a specific momentum tool that shows where the current value sits between its recent high and low to flag overbought or oversold zones on a 0–100 scale. Drop it into any selector incantation—If/Else, Switch, Enter/Exit, you name it—and QuantMage will tell you where the current value sits inside its look‑back window.
You can even get meta and point it at a momentum indicator—measuring the momentum of momentum.
Where to find it
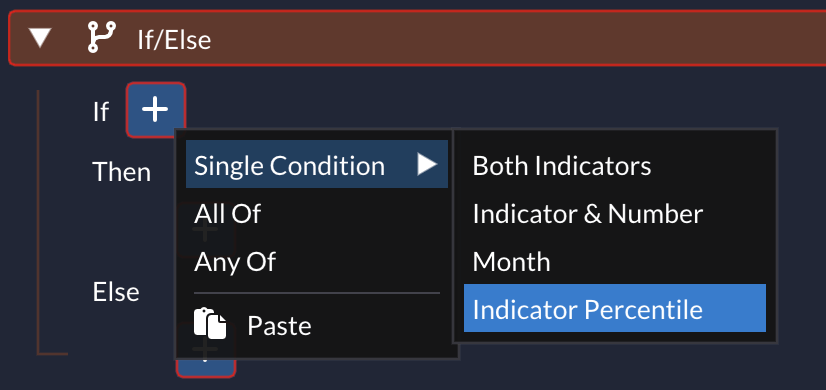
Section titled “Where to find it”Anywhere you can add a condition inside a selector incantation, open the dropdown and scroll to the relevant options at the bottom:
Dial in the settings
Section titled “Dial in the settings”- Look‑back period – How many past bars should we peek at?
- Side of the distribution – Are you hunting for the top rank (overbought, breakout vibes) or the bottom rank (oversold, mean‑reversion territory)?
- Threshold – The cutoff in percentage terms (e.g., top‑5% or bottom‑5%).
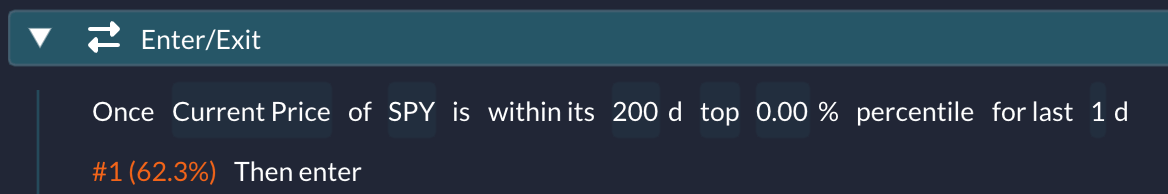
Example 1: The snippet below checks whether today’s SPY close is at a 200‑day high before opening a position:
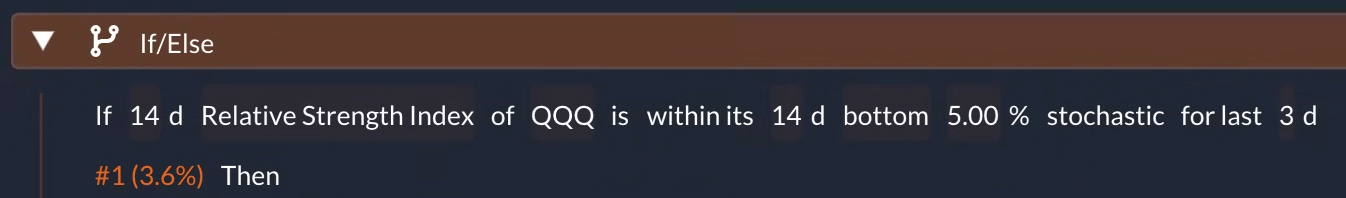
Example 2: This one gauges QQQ’s Stochastic RSI to ride oversold bounces:
When you mix Indicator Percentile/Stochastic with QuantMage’s full indicator arsenal, you’re not just looking at raw numbers—you’re adding context, momentum, and statistical edge to every spell in your book.